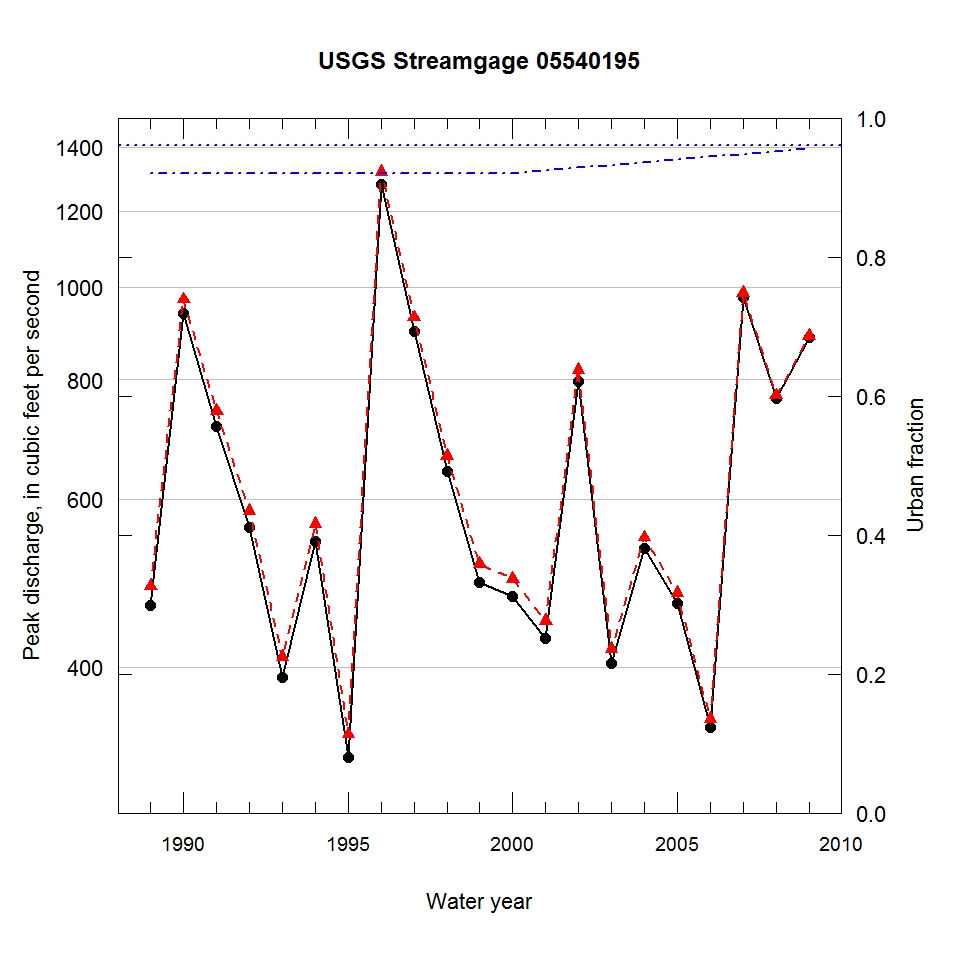
Observed and urbanization-adjusted annual maximum peak discharge and associated urban fraction and precipitation values at USGS streamgage:
05540195 ST. JOSEPH CREEK AT ROUTE 34 AT LISLE, IL


| Water year | Segment | Discharge code | Cumulative reservoir storage (acre-feet) | Urban fraction | Precipitation (inches) | Observed peak discharge (ft3/s) | Adjusted peak discharge (ft3/s) | Exceedance probability |
| 1989 | 1 | C | 0 | 0.920 | 2.223 | 464 | 486 | 0.506 |
| 1990 | 1 | C | 0 | 0.920 | 1.748 | 938 | 970 | 0.048 |
| 1991 | 1 | C | 0 | 0.920 | 1.709 | 715 | 742 | 0.143 |
| 1992 | 1 | CD | 0 | 0.920 | 1.336 | 560 | 583 | 0.297 |
| 1993 | 1 | C | 0 | 0.920 | 1.091 | 390 | 410 | 0.677 |
| 1994 | 1 | C | 0 | 0.920 | 1.572 | 542 | 565 | 0.337 |
| 1995 | 1 | CE | 0 | 0.920 | 1.219 | 322 | 340 | 0.821 |
| 1996 | 1 | C | 0 | 0.920 | 5.119 | 1280 | 1320 | 0.018 |
| 1997 | 1 | C | 0 | 0.920 | 2.545 | 898 | 929 | 0.057 |
| 1998 | 1 | C | 0 | 0.920 | 1.828 | 641 | 665 | 0.196 |
| 1999 | 1 | C | 0 | 0.920 | 1.485 | 491 | 513 | 0.451 |
| 2000 | 1 | C | 0 | 0.920 | 1.307 | 474 | 495 | 0.486 |
| 2001 | 1 | C | 0 | 0.924 | 0.756 | 429 | 447 | 0.583 |
| 2002 | 1 | C | 0 | 0.928 | 2.020 | 796 | 819 | 0.096 |
| 2003 | 1 | C | 0 | 0.932 | 1.124 | 404 | 418 | 0.655 |
| 2004 | 1 | C | 0 | 0.936 | 1.520 | 533 | 547 | 0.381 |
| 2005 | 1 | CE | 0 | 0.940 | 1.577 | 467 | 478 | 0.522 |
| 2006 | 1 | C | 0 | 0.944 | 2.258 | 346 | 353 | 0.796 |
| 2007 | 1 | C | 0 | 0.948 | 3.274 | 975 | 985 | 0.046 |
| 2008 | 1 | C | 0 | 0.952 | 2.868 | 764 | 770 | 0.125 |
| 2009 | 1 | C | 0 | 0.956 | 2.344 | 886 | 889 | 0.068 |

